C's memory model is not explicitly enforced by its runtime system, and novices often write code that violates the memory model and causes cryptic segmentation faults/memory corruptions. This is one major source of frustration.
cee.studio Solution
Instant and informative feedback on the occurrence of mishandled pointers and memory Learn more:Understanding pointer requires the practice of visualizing how different memory locations are linked through pointers by looking at C code. Not mastering pointer escalates the first challenge and causes more frustration.
cee.studio Solution
Instant visual feedback as to how each statement manipulates pointers and memory Learn moreThe Guard Rail of C's Memory Model
SaiphC explicitly enforces C's memory model and reports many memory access violations with deterministic and informative diagnostic messages. This feature removes the major sources of frustration in C/C++. The diagnostic messages are crafted to convey C's memory model with information to make a fix.
Comparision with other memory error finding tools in table
Examples
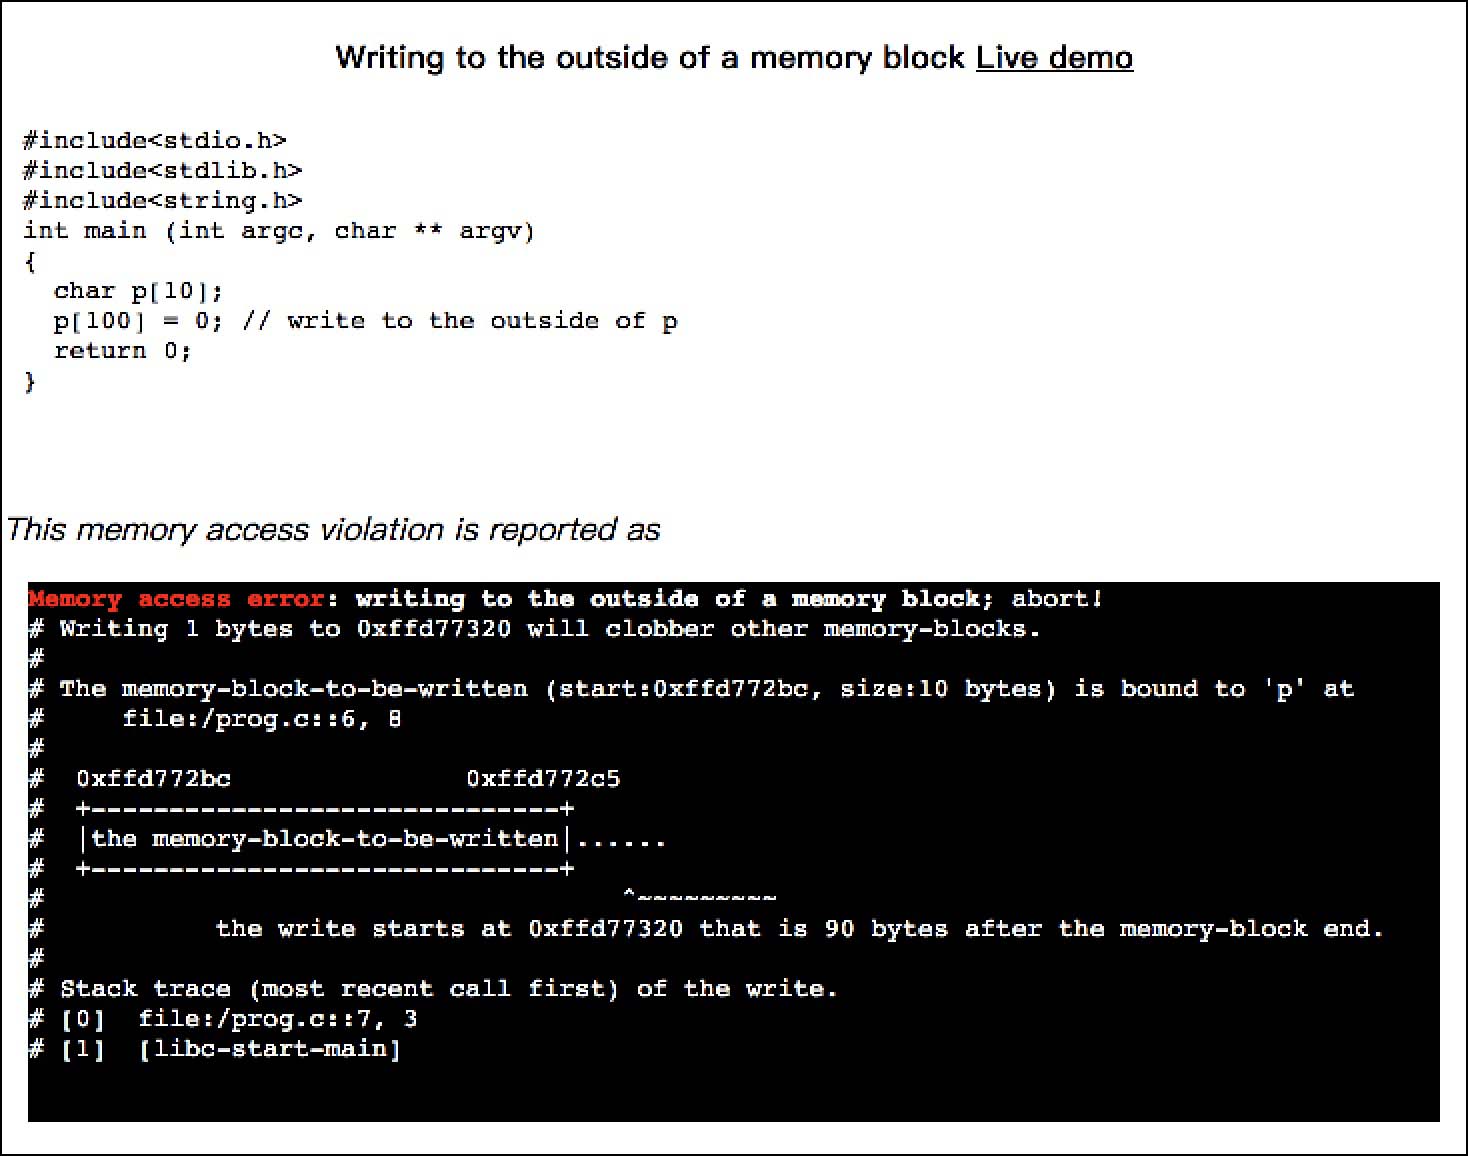
The following are examples of common memory access violations. The
companying live demos can be executed by clicking
 .
.
#include<stdio.h>
#include<stdlib.h>
#include<string.h>
int main (int argc, char ** argv)
{
  char p[10];
  p[100] = 0; // write to the outside of p
  return 0;
}
This memory access violation is reported as
#include<stdio.h>
#include<stdlib.h>
#include<string.h>
int main (int argc, char ** argv)
{
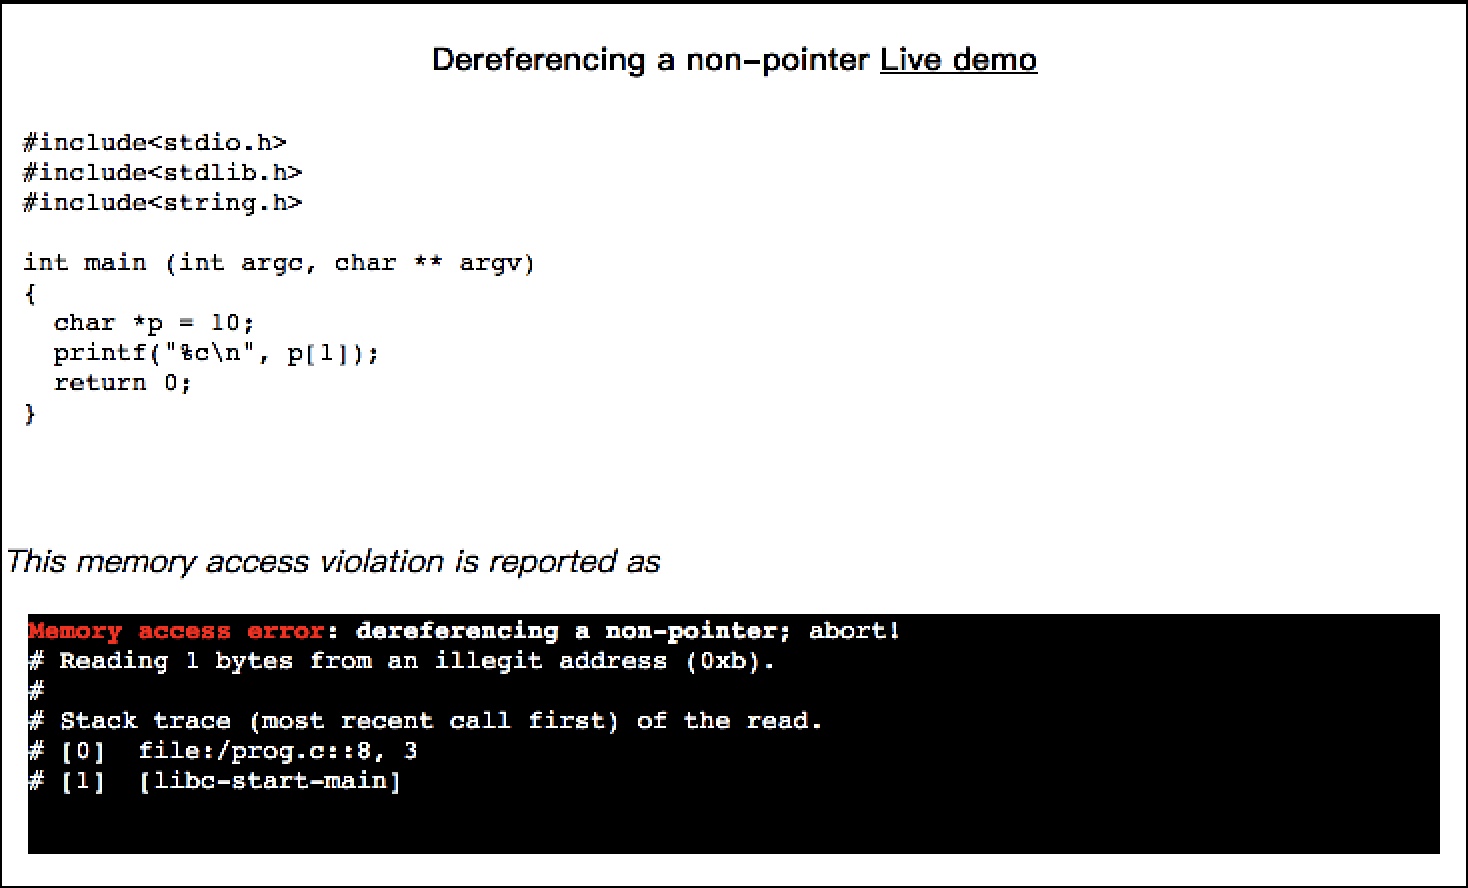
char *p = 10;
printf("%c\n", p[1]);
return 0;
}
This memory access violation is reported as
#include<stdio.h>
#include<stdlib.h>
#include<string.h>
int main (int argc, char ** argv)
{
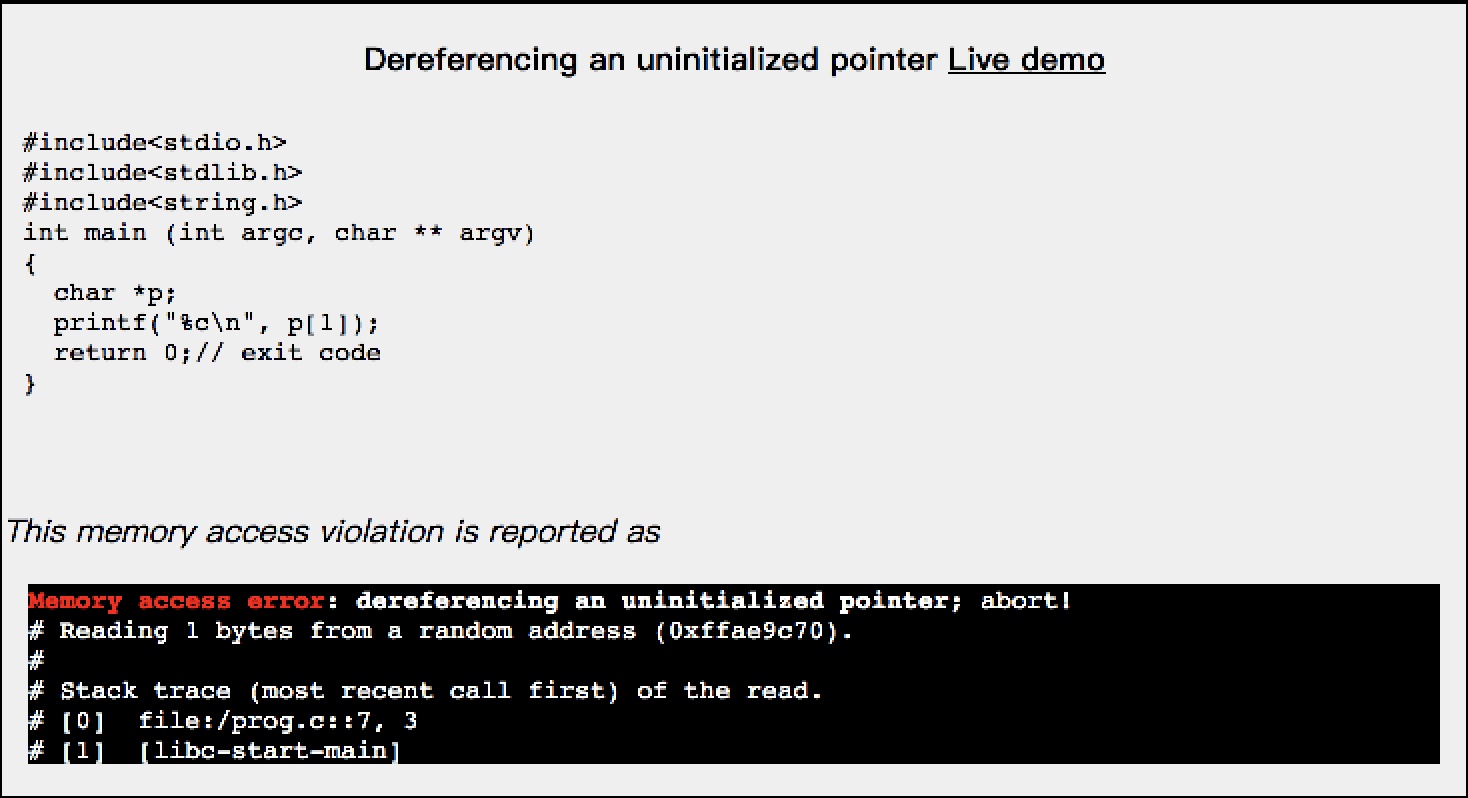
char *p;
printf("%c\n", p[1]);
return 0;// exit code
}
This memory access violation is reported as
#include<stdio.h>
#include<stdlib.h>
#include<string.h>
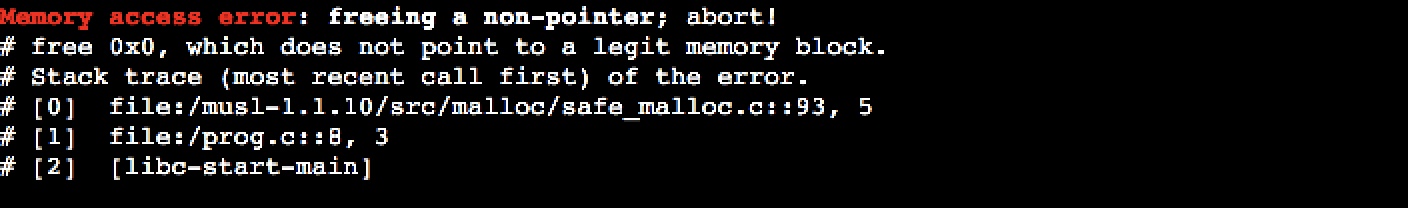
int * p = 0;
int main (int argc, char ** argv)
{
free(p);
return 0;
}
This memory access violation is reported as
#include<stdio.h>
#include<stdlib.h>
#include<string.h>

int main (int argc, char ** argv)
{
  char * p = malloc(10);
  free(p);
  free(p);
  return 0;// exit code
}
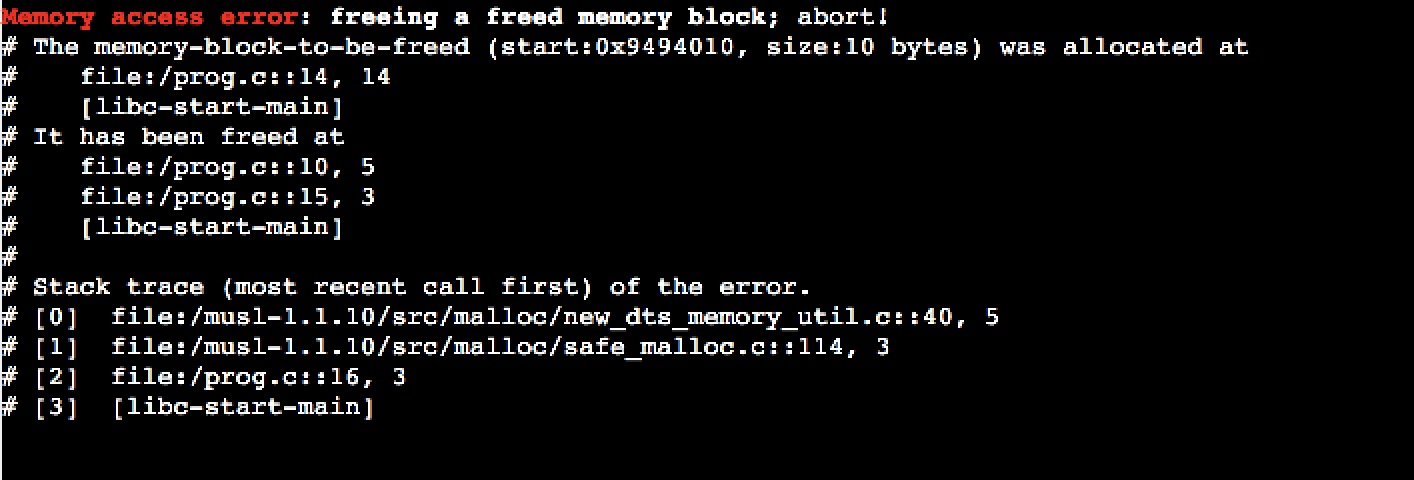
This memory access violation is reported as
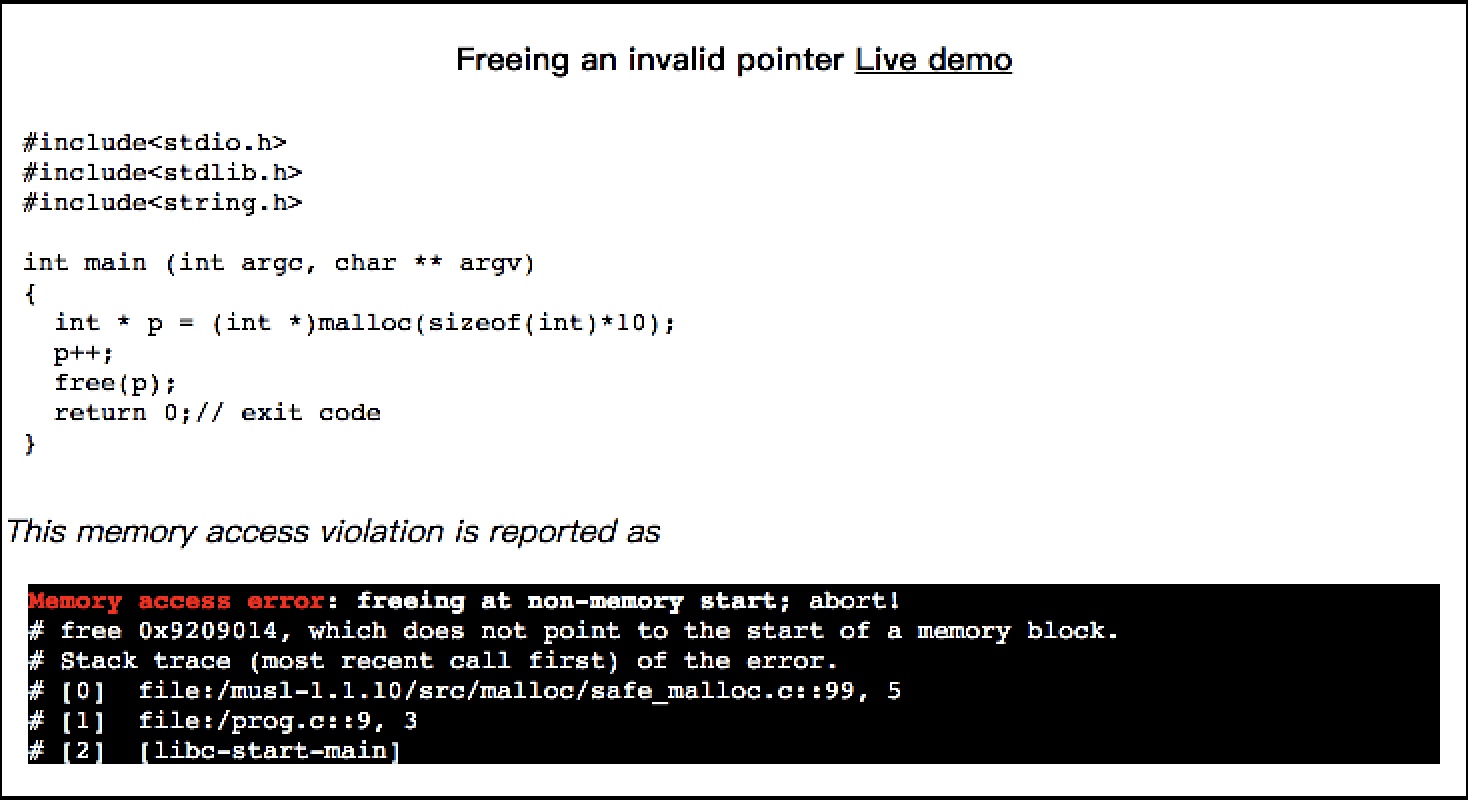
#include<stdio.h>
#include<stdlib.h>
#include<string.h>

int main (int argc, char ** argv)
{
  int * p = (int *)malloc(sizeof(int)*10);
  p++;
  free(p);
  return 0;// exit code
}
This memory access violation is reported as
#include<stdio.h>
#include<stdlib.h>
#include<string.h>

int main (int argc, char ** argv)
{
  char * p = "hello world";
  p[0] = 0;
  return 0;
}
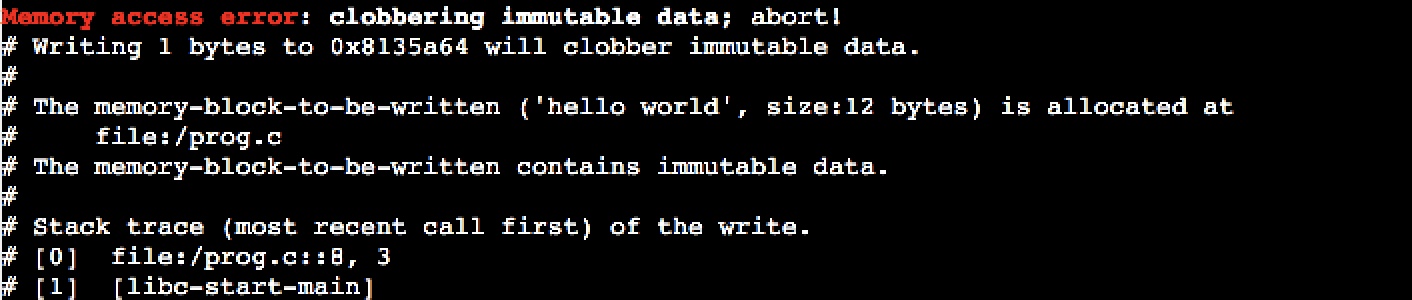
This memory access violation is reported as
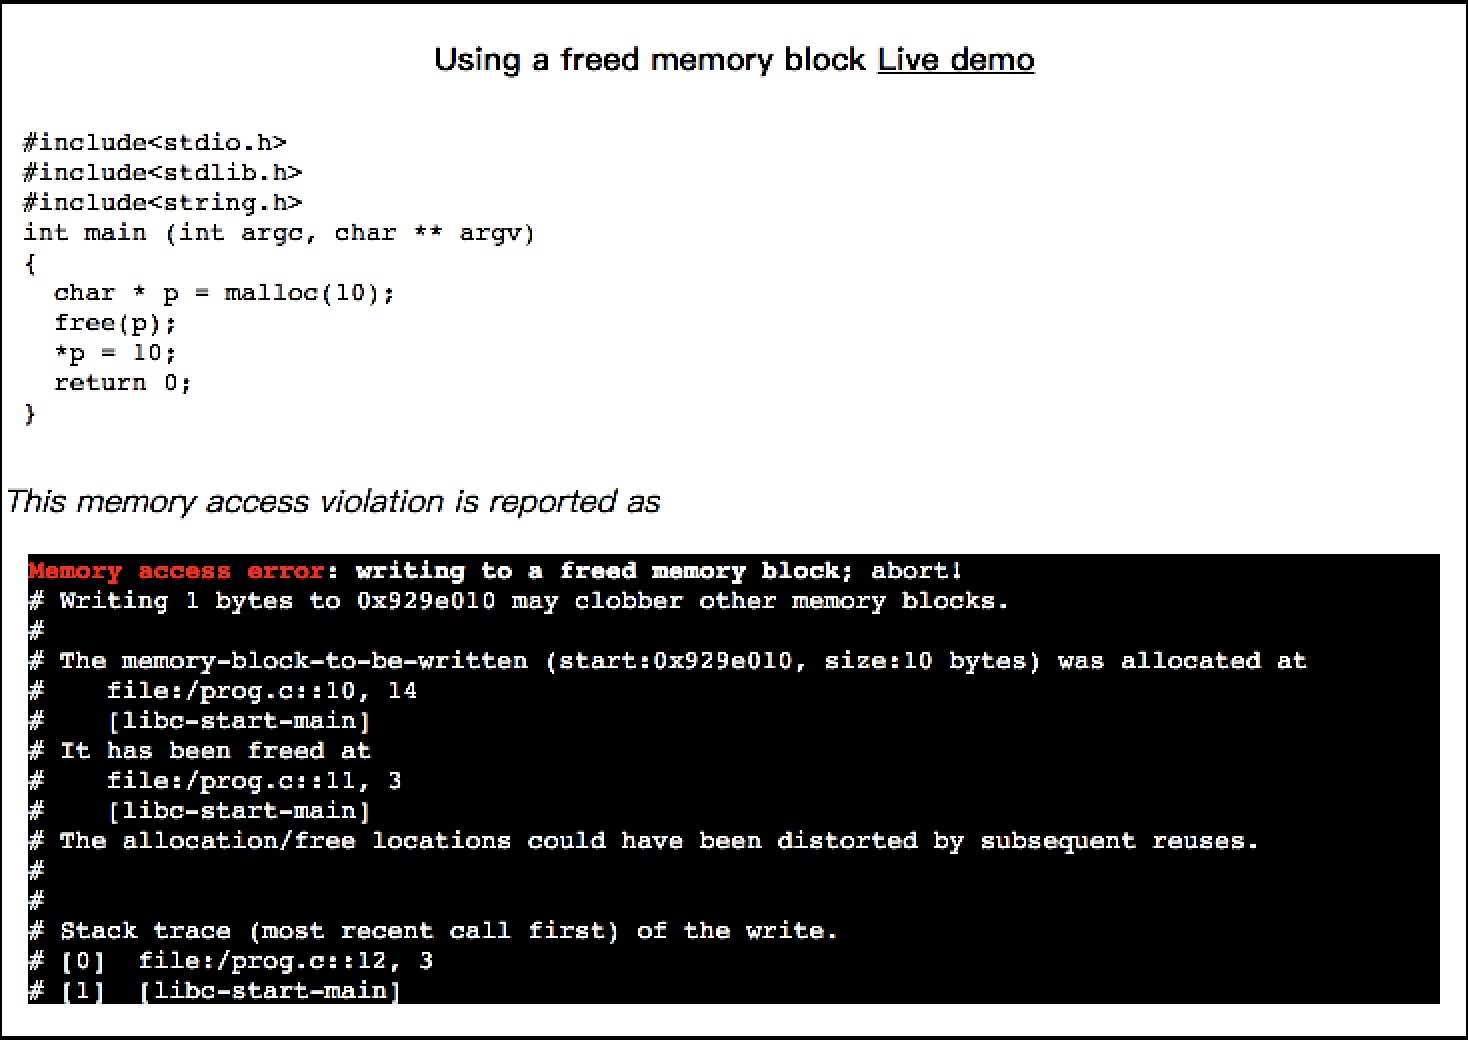
#include<stdio.h>
#include<stdlib.h>
#include<string.h>
int main (int argc, char ** argv)
{
  char * p = malloc(10);
  free(p);
  *p = 10;
  return 0;
}
This memory access violation is reported as
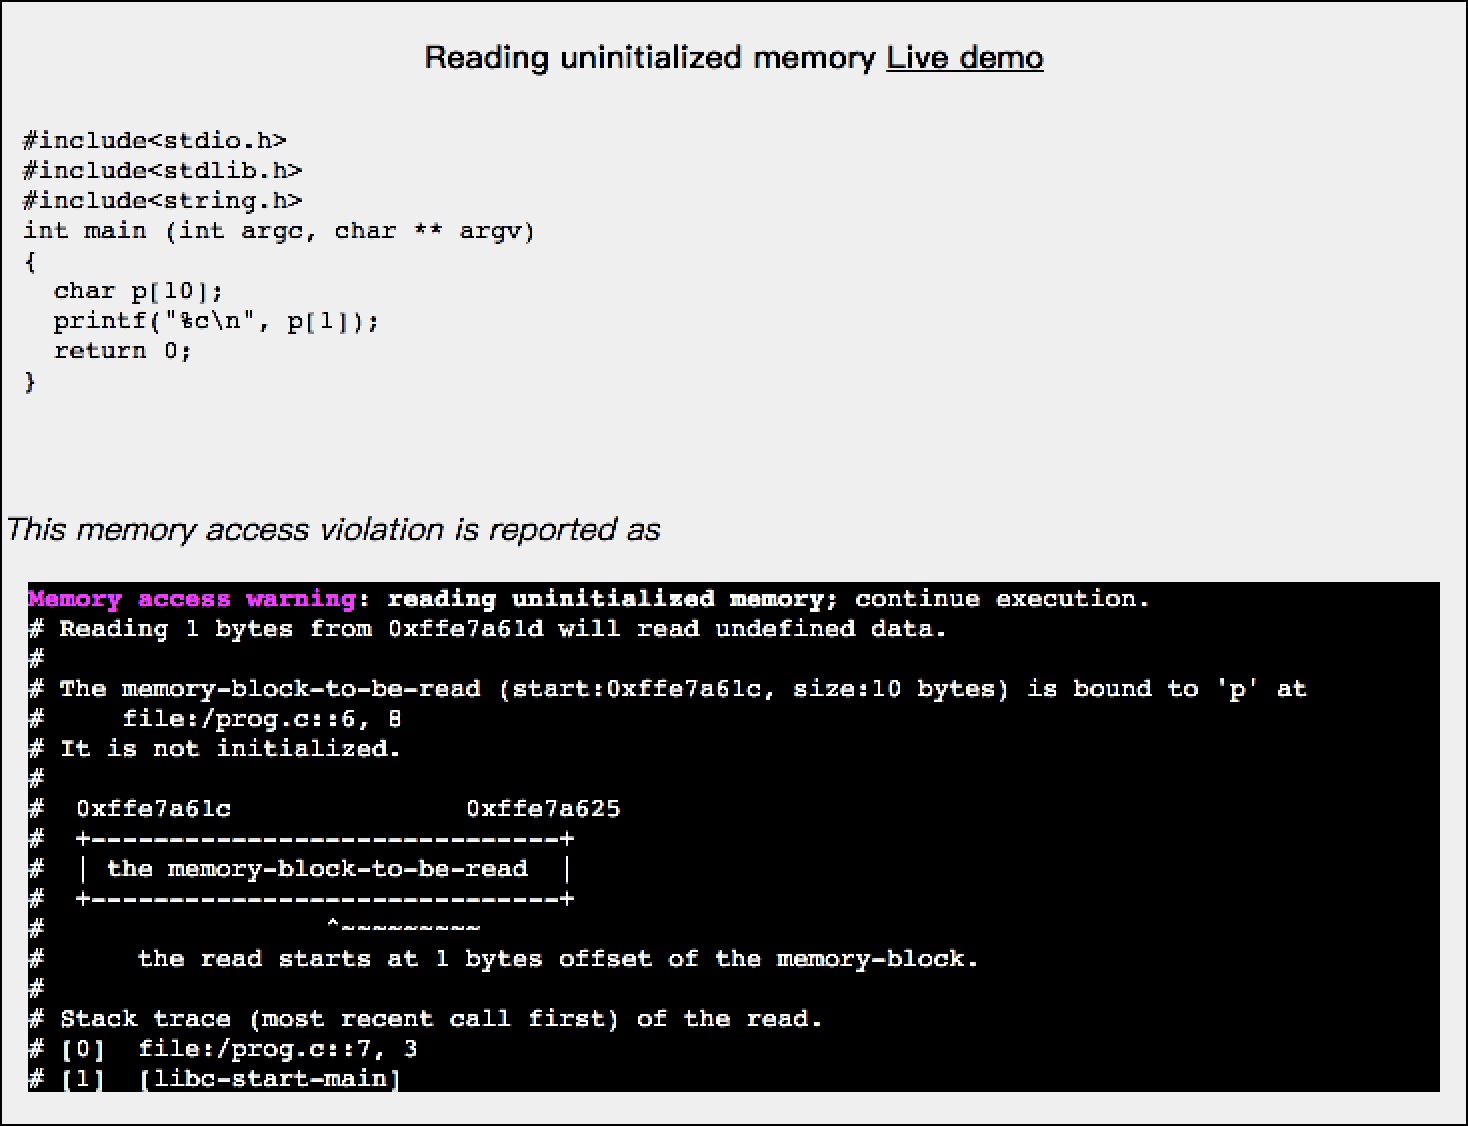
#include<stdio.h>
#include<stdlib.h>
#include<string.h>
int main (int argc, char ** argv)
{
  char p[10];
  printf("%c\n", p[1]);
  return 0;
}
This memory access violation is reported as
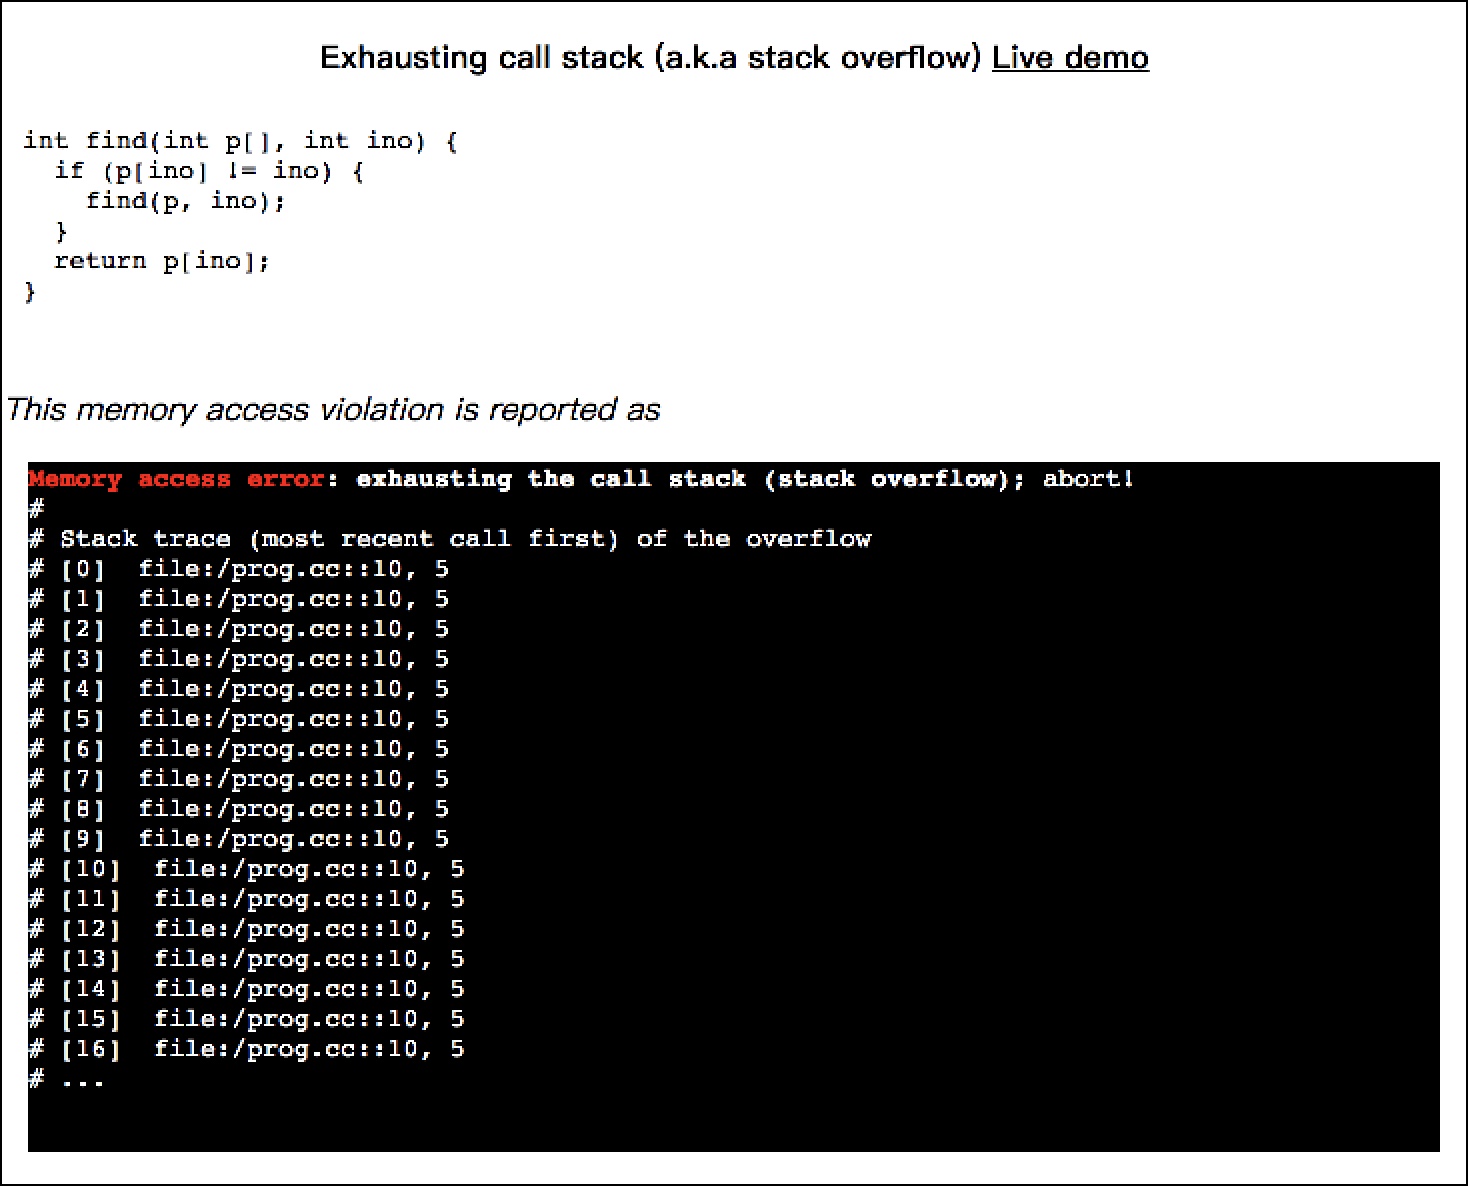
int find(int p[], int ino) {
  if (p[ino] != ino) {
    find(p, ino);
  }
  return p[ino];
}
This memory access violation is reported as
Turn Abstract Pointers to Concrete Points-to Graph
This feature does not work well with C++ code due to C++'s pervasive use of copy constructors.
cee.studio can record the execution of C code statement by statement. In the recorded execution, each frame consists of
- the statement has run, highlighted
- the backtrace of the statement
- the points-to graph that is constructed
The recorded execution can be rewound to any statements and replayed, providing a visualization of how memory locations are linked by pointers statement-by-statement. In each points-to graph, nodes represent the memory blocks, directed edges represent the points-to relations. Clicking on a node will highlight the statement that allocates a memory block. Clicking on an edge will highlight the assignment statement that created that points-to relation.
Example
The following GIF shows a recorded execution of creating a sorted singly linked list.
The following accompanying live demo can be executed by clicking
 .
.
Generic sorted single linked list Live demo